Apple Valley Housing Market Trends Buyers Should Know
February 19, 2026
February 19, 2026
You have your eye on Apple Valley, but the headlines feel all over the place. One site shows prices jumping, another looks flatter, and recent listings seem to move in fits and starts. You are not alone. In this quick guide, you will see the key housing trends local buyers should understand right now, why the numbers differ by source, and how to shape a winning plan in a still-competitive market. Let’s dive in.
Apple Valley sits in the mid to upper range of the east metro on price and remains competitive. Recent trackers show a January 2026 median sale price near $425,000 with about 53 median days on market, sale-to-list around 99 percent, and roughly 28 closings for the month. Another well-known tracker places the typical home value closer to $365,000 and shows about 102 active listings at month end with a median days-to-pending near 49.
These differences come from the way each source measures the market. One reflects closed-sale medians for a single month of MLS activity, and the other is a modeled home-value index that smooths out month-to-month swings.
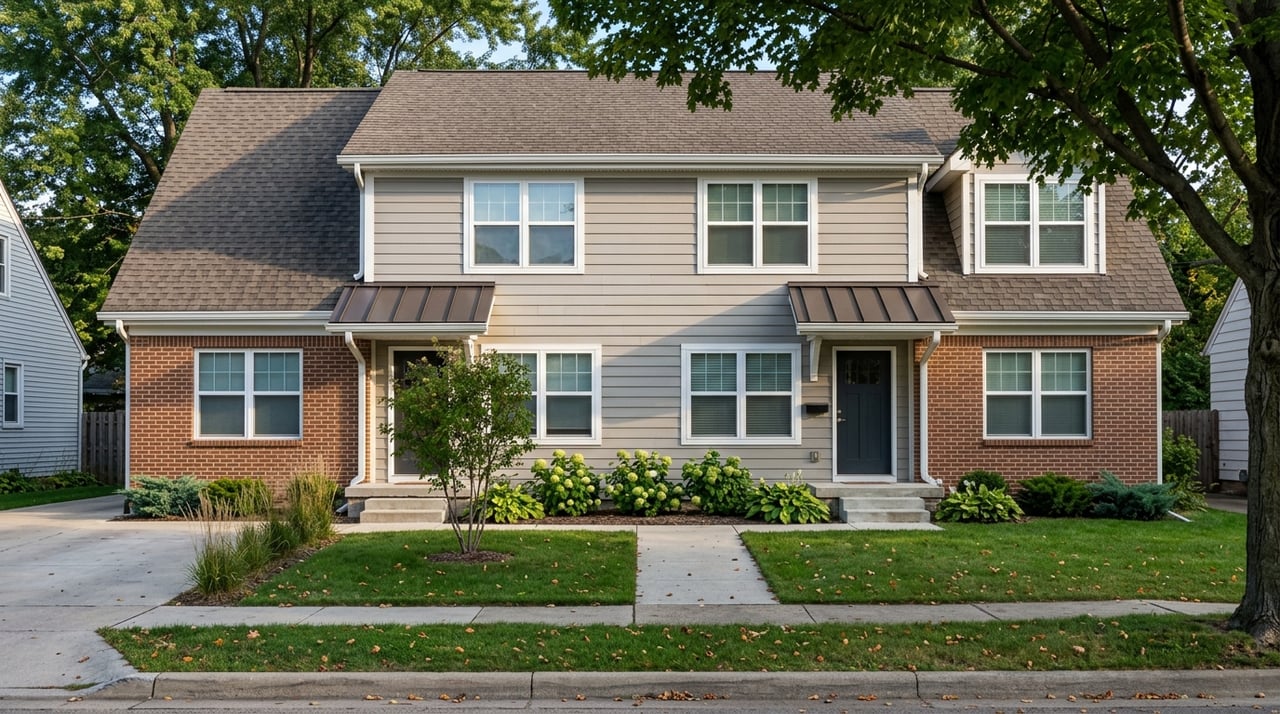
Apple Valley has about 22,000 housing units with an owner-occupied rate near 73 percent and a median owner-occupied value around $370,400, based on ACS 2020–2024 estimates. You can confirm long-run context in ACS QuickFacts for Apple Valley and the Census Reporter city profile.
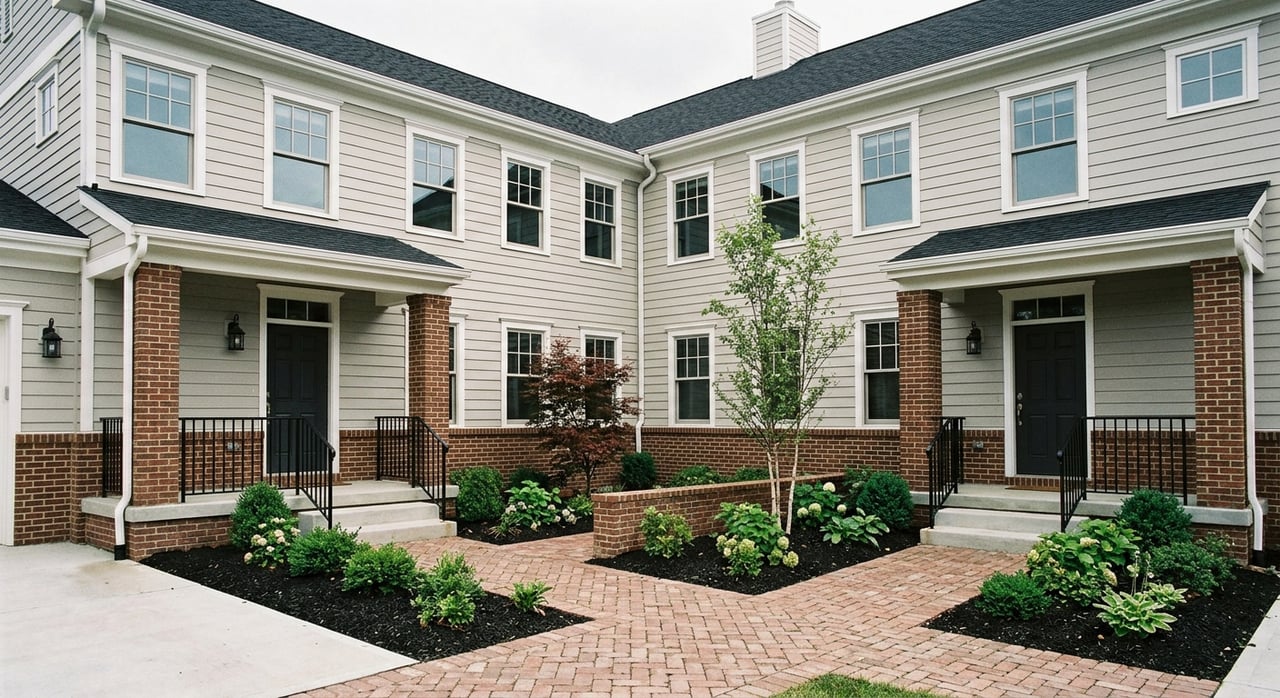
New construction is mainly smaller townhome communities and selective single-family infill. Countywide permitting shows steady but not massive new-home production. Dakota County logged 2,146 building permits in 2024, a scale that supports incremental supply rather than large master-planned growth. See county-level context in Dakota County QuickFacts. For business and planning resources, the city also maintains Apple Valley’s business resources page.
What this means for you: resale inventory matters more than big new subdivisions nearby, so well-priced listings can still draw solid attention.
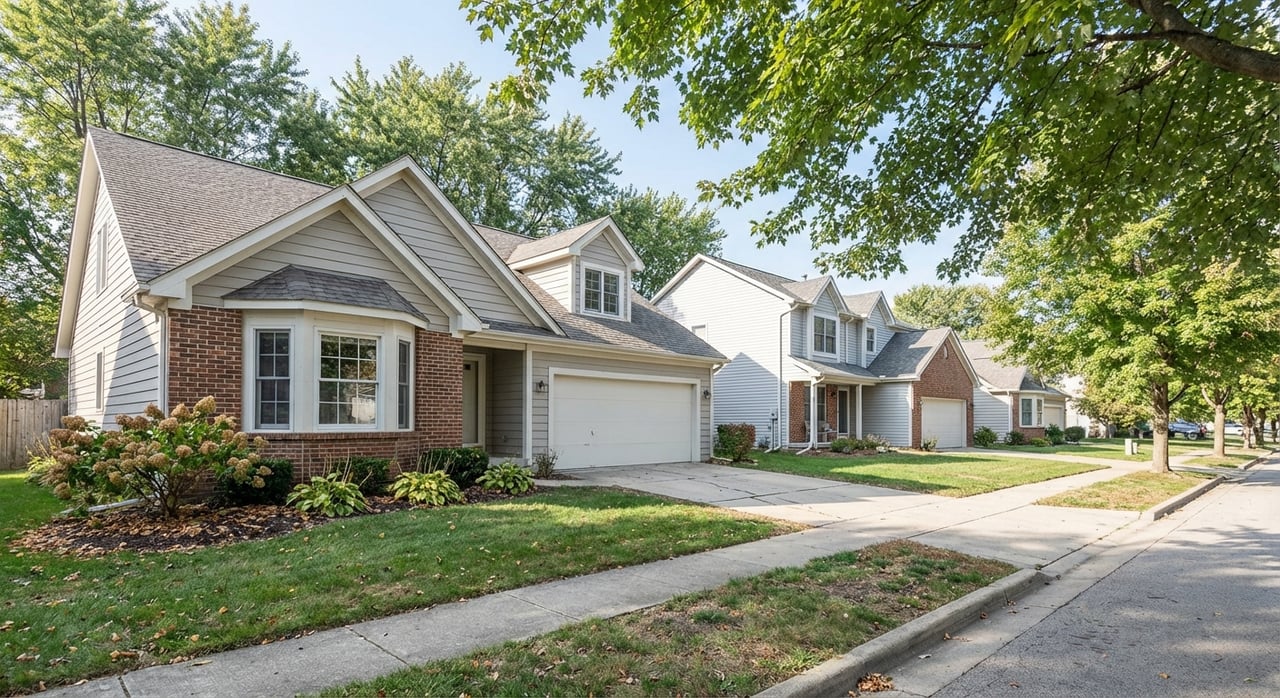
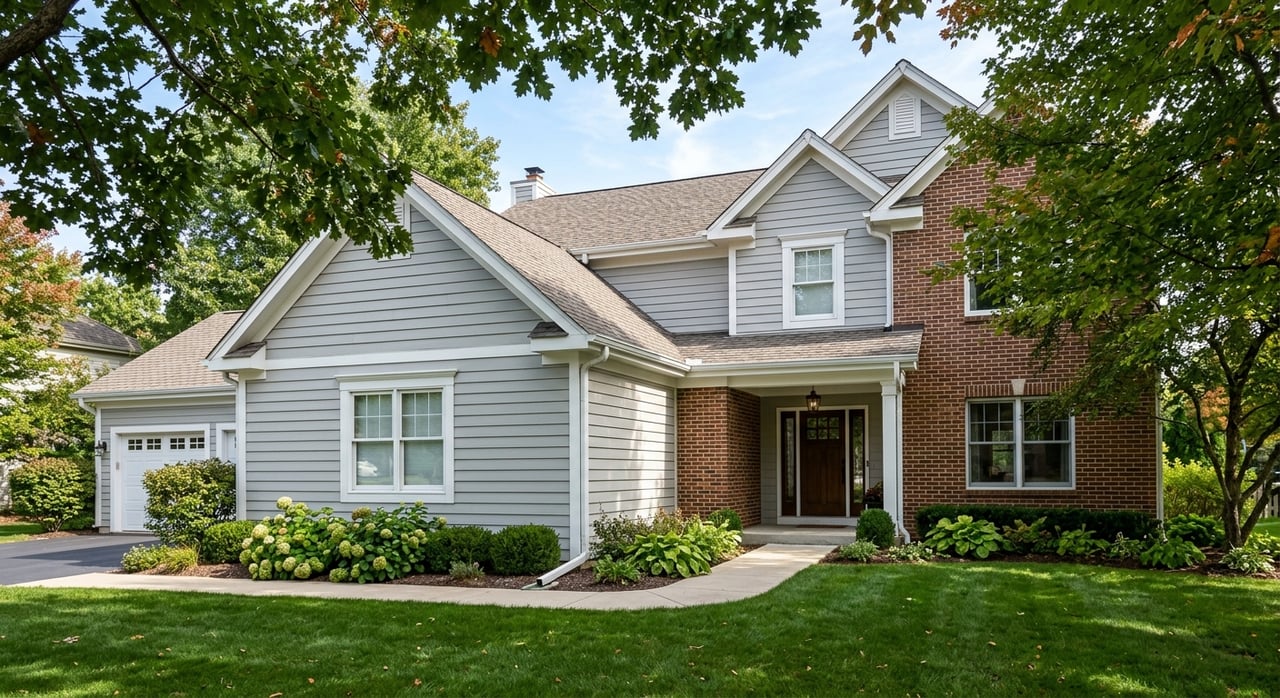
City medians mask real variation by neighborhood and property type. Apple Valley is dominated by single-family homes, with pockets of townhomes and condos. Some neighborhoods sit well above the city median, while others are below it. Condition, updates, and location within the city often matter more than the citywide average.
A quick affordability frame helps set expectations. Using a recent closed-sale median near $425,000 and an ACS 2020–2024 median household income around $97,673, the price-to-income ratio is roughly 4.3. This is a directional guide, not a rule, since each buyer’s financing, down payment, and debts differ. You can review the income baseline in ACS QuickFacts for Apple Valley.
Note on data quality: city-level monthly medians can swing because only a small number of sales close in any given month. For trend statements, lean on 3 to 12 month rolling medians or metro-level snapshots from Minneapolis Area REALTORS.
Apple Valley is still very competitive. Recent indicators show sale-to-list prices near parity and a meaningful share of homes selling above list. Depending on timing and property, you may face multiple offers on well-priced, move-in ready listings. At the same time, not every home gets bid up, which is why a clean, well-documented offer can win without extreme concessions.
Practical steps for writing a sharp offer:
Plan for the calendar too. Financed purchases commonly take about 30 to 45 days from contract to close. Inspection windows often run about 7 to 10 days, followed by appraisal and underwriting. For timing details, see this clear industry summary on typical contract-to-close timelines.
Spring is historically the busiest period for listings and buyer activity in the Twin Cities. Competition tends to rise in March through June, then ease in late fall and winter. The National Association of REALTORS notes that timing your list or search for peak weeks can affect activity levels. See their overview on seasonal best weeks to list.
If you compare east-metro options, Apple Valley typically sits above Burnsville and parts of Eagan on price, and below Lakeville. Rosemount often tracks close to Apple Valley but varies by neighborhood. Days on market can also differ from city to city. Use these comparisons as a quick screen, then evaluate specific neighborhoods, commute patterns, and property condition.
If you want a local read on a specific Apple Valley home or neighborhood, reach out. You will get practical guidance tailored to your goals from Gary L Bredeson, a responsive, east-metro advisor who will help you move with clarity and confidence.
Stay up to date on the latest real estate trends.
With nearly two decades helping clients in White Bear Lake and the Twin Cities, I know the local market inside and out. Whether you’re buying your first home or selling your last, I’ll put my knowledge and dedication to work to help you achieve the best outcome. Let’s start your journey today.